Industry benchmark for Google Sheets™
See how your company compares with its industry
Six key figures next to the official statistics for your industry, in your spreadsheet, with a one-page PDF you can hand to the owner. 14 days free with everything, then from €19 a month, or €4 per client for accounting firms.
Benchmarkly is on its way to the Google Workspace Marketplace™. Sign up and we send the link the day it is ready.
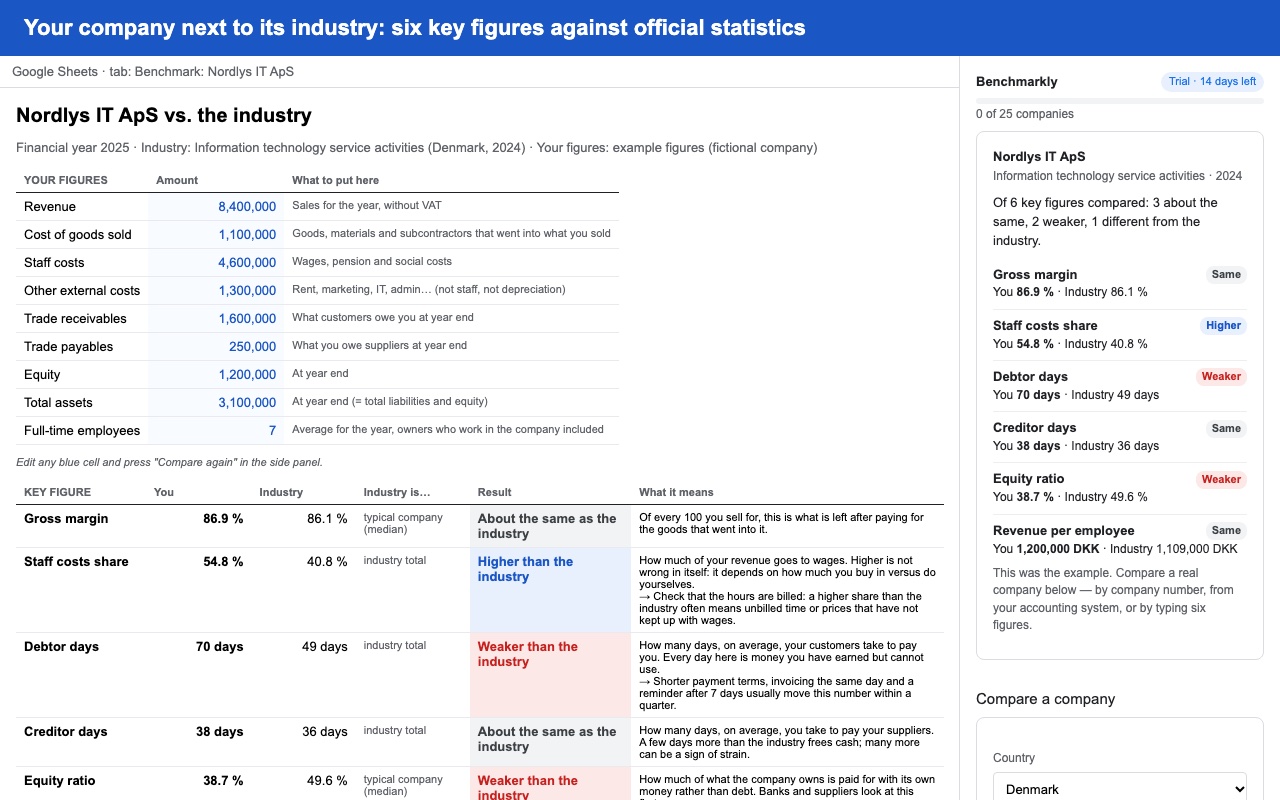
Six key figures an owner understands
Every line says what the number means in plain words, whether the company is better, about the same or weaker than its industry, and what usually moves it.
Gross margin
What is left of every 100 you sell for, after the goods that went into it.
Staff costs share
How much of the revenue goes to wages, pension and social costs.
Debtor days
How long customers take to pay. Every day is money earned but not yet in the bank.
Creditor days
How long the company takes to pay its suppliers.
Equity ratio
How much of what the company owns is paid for with its own money. Banks look at it first.
Revenue per employee
What each full-time employee brings in: productivity and pricing in one number.
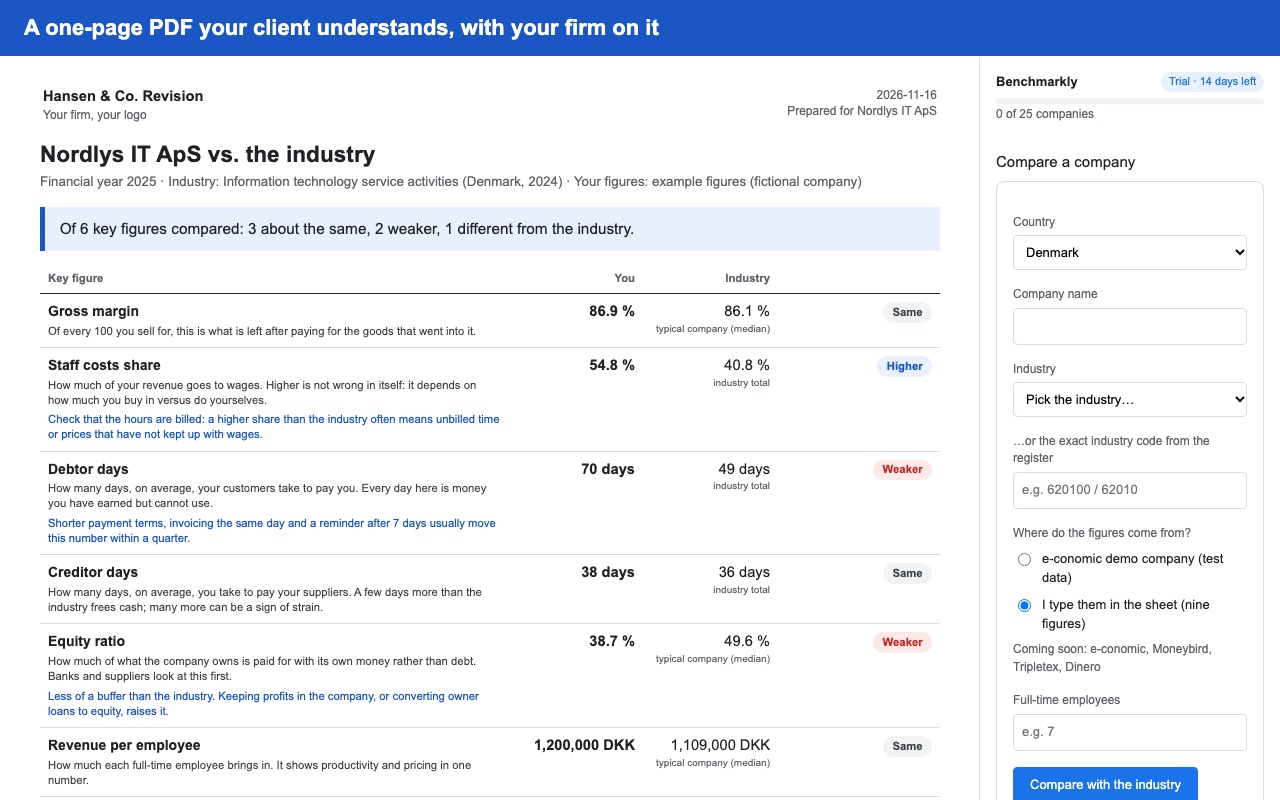
A PDF for the client meeting, with your firm on it
One page: the headline, the six figures, what each means and where the industry figures come from. On the paid plans it carries your firm's name, contact and logo, and Benchmarkly can mail an updated PDF to you and your client every quarter.
Official statistics, and a plain “no data” where there is none
The industry figures come from Danmarks Statistik, SCB, Statistics Norway, Statistics Finland and Eurostat, the newest year they have published. Where an office publishes no figure for the industry, the line says so instead of guessing.
Prices
Free
€0
1 company
- Gross margin, debtor days and equity ratio
- 1 client PDF per quarter
- All countries and industries
Business
€19
a month, or €190 a year
- Up to 3 companies
- All six key figures
- Unlimited PDFs with your name on them
- Updated PDF by mail every quarter
Accountant
€4
per client a month, from 10 clients
- Everything in Business, for every client
- Your firm's name and logo on every PDF
- Quarterly PDF straight to each client
Prices exclude VAT. Every plan starts with 14 days with everything open, no card needed. Payment by Stripe; cancel any time.
How to compare a company with its industry in Google Sheets™
- 1
Install Benchmarkly in Google Sheets™
Open a spreadsheet and choose Extensions → Benchmarkly → Open. Press “Show me an example” to see a full comparison in under a minute.
- 2
Bring in the figures
Connect e-conomic, Moneybird, Tripletex or Dinero, type the company number to start from its filed annual accounts, or type nine figures by hand.
- 3
Pick the industry and compare
The industry comes from the company register or a list. Benchmarkly fetches the newest official statistics and writes the comparison into a new tab, with a PDF for the client.
Questions
Where do the industry figures come from?
From the national statistics offices: Danmarks Statistik (accounts statistics for 101 industries, with medians), SCB in Sweden, Statistics Norway, Statistics Finland, and Eurostat for the other EU countries. They are official, published every year, and the add-on always uses the newest year.
What happens when there is no industry figure?
The line says “No industry data”. Benchmarkly never estimates a figure the statistics office has not published. Eurostat, for example, has no balance sheets, so debtor days and equity ratio are only compared in Denmark, Sweden and Norway.
Which accounting systems does it read from?
e-conomic, Moneybird, Tripletex and Dinero, read-only. You can also start from a company's filed annual accounts by typing its company number, or type the figures yourself, so it works with any accounting system.
Can I see which accounts count as revenue, cost of goods or staff costs?
Yes. Every account from the books is listed in a Mapping tab with the category Benchmarkly chose and why. Change a category in the dropdown and compare again.
We are an accounting firm. What does it cost per client?
€4 per client a month, from 10 clients. Every PDF carries your firm's name, contact and logo, and each client can get an updated PDF by mail every quarter.
Do you keep our accounting figures?
No. The figures pass from the accounting system through our server in the EU and into your spreadsheet. We keep the connection, encrypted, so the quarterly update can run, and nothing else from the books.
Help and support · Privacy · Terms
Google Sheets™ is a trademark of Google LLC. e-conomic, Dinero, Tripletex and Moneybird are trademarks of their owners; we are not affiliated with them.